What is climate change, and why does it happen?
On this page:
Climate and Weather
Before we can understand what climate change is, we have to understand what climate is! A good place to start is by thinking about the difference between climate and weather.
Weather is the day-to-day or hour-to-hour change in variables like temperature, rainfall, and wind. It sometimes feels like the weather changes from minute to minute!
Climate, on the other hand, is the average of weather variables over the long term: technically, at least three decades. In Ithaca, New York, we live in a climate with four seasons, with warm summers and cold, snowy winters, and we average about 40 inches of rain per year.
Weather vs. Climate
Knowing what the weather is like tells you what kind of clothes to wear.
Knowing what the climate is like tells you what kind of clothes to own.
Made with Visme
Clothing drawings by Lenka Bartušková, via Pixabay
What is climate change?
Climate change is a significant change in long term (three decades or more) averages of weather variables like temperature, rain and snowfall, wind, and storms. This change affects humans and other life on Earth, natural systems, and built systems like infrastructure and the economy.
In Tompkins County, the climate has been changing over the last few decades—it’s been getting warmer and wetter.


Tompkins County Data: NOAA National Centers for Environmental Information, Climate at a Glance
Weather Station Data
What’s the weather like right now on the west side of Cayuga Lake in Ithaca, New York?
The data you see here come from a weather station at the Museum of the Earth, a few miles down the road from the Cayuga Nature Center. They show the influence of Cayuga Lake on the microclimate here. A microclimate is the climate of a very small area—it can be snowing up on Ithaca’s East Hill while it’s raining in downtown Ithaca.
Even different hillsides can have different microclimates. Wineries and other agricultural businesses can use information from weather stations to their advantage, for example, to decide the best location to plant grapes to protect them from frost damage.
While the effect of global climate change on a particular location will depend on local factors that influence its microclimate, we can average together data from the many weather stations around us to see how climate change is playing out.
The Greenhouse Effect
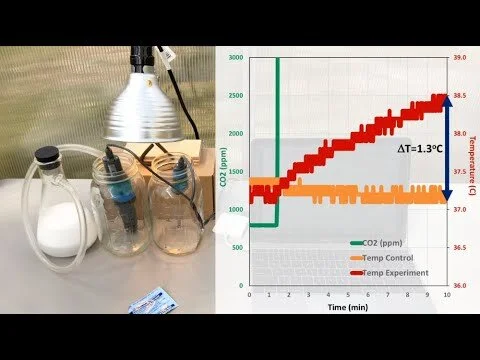
Carbon dioxide (CO₂) and other gases in the atmosphere trap heat around the Earth—a process called the greenhouse effect. Learn more about the greenhouse effect in an online version of an exhibit on climate change at the Museum of the Earth.
Even though the amount of greenhouse gases in the atmosphere is small compared with other gases, changes in this amount can make a big difference in how the atmosphere behaves.
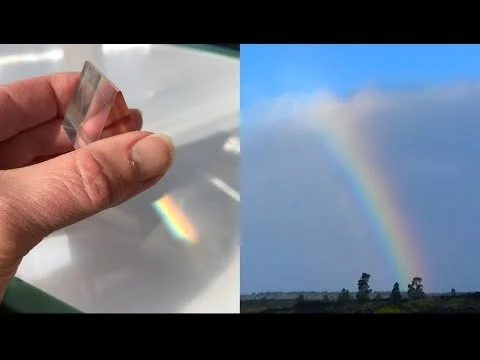
Learn more about the science of the greenhouse effect in these videos:

Earth’s climate has changed in the past
Earth’s climate has changed many times over its 4.5 billion year history, at times gradually and at other times rapidly. Natural causes include changes in the Earth’s orbit around the sun, changes in the output of energy from the sun, and volcanic activity.
Watch these videos to learn more:
Watch this video to learn about the contributions of natural and human factors to climate change in the last 140 years.
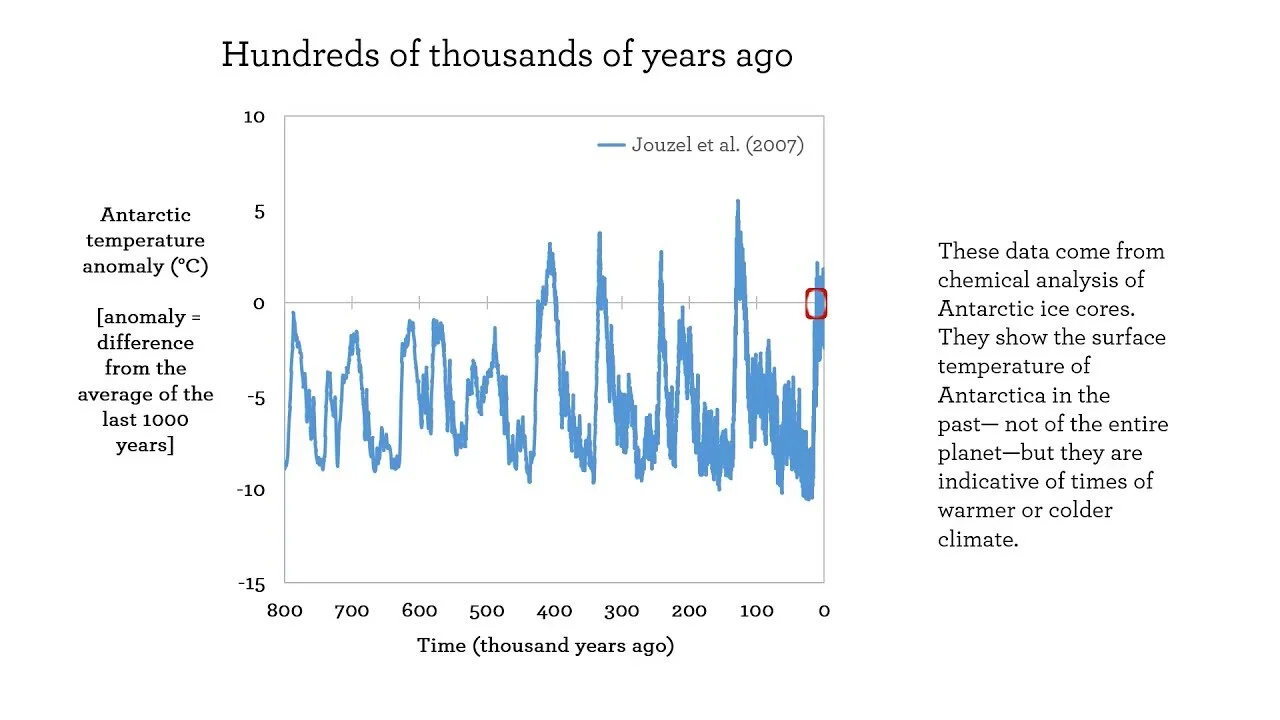
Watch this video to see how Earth’s temperature has changed over time, from millions of years ago to today.
Climate affects life and life affects climate
Life on Earth has affected climate just as climate has affected life. For example, around 300 million years ago, expanding forests absorbed heat-trapping carbon dioxide through photosynthesis. Many of these plants lived in swamps with surface water that was low in oxygen, so the plants didn’t decompose easily when they died. Instead, the plants were buried and the carbon they stored was not returned to the atmosphere—this eventually led to a cooling of the Earth. The plants fossilized after millions of years and turned into coal, effectively storing energy from the sun underground.
The diagram below shows the connections between life on Earth and carbon in the atmosphere, through the carbon cycle.
Carbon fluxes (flows) are expressed in gigatons (billion tons) of carbon per year. Yellow numbers are natural carbon fluxes, and red are human contributions. White numbers indicate stored carbon, in gigatons.
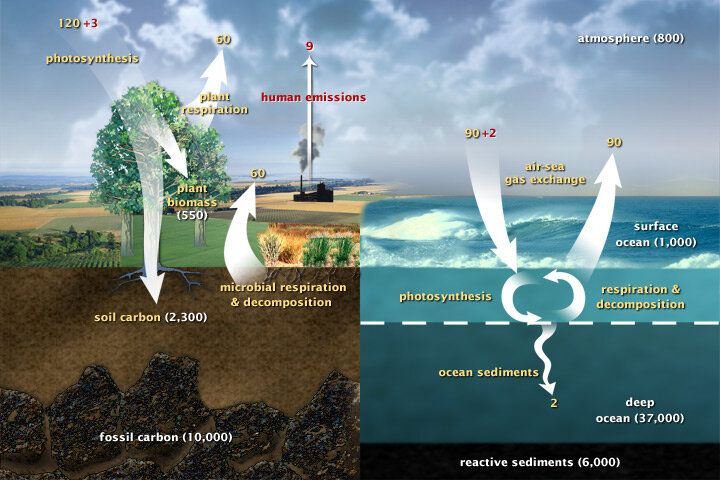
Diagram: NASA Earth Observatory, The Carbon Cycle
Today, human activity is warming the planet very rapidly
Since the dawn of the Industrial Revolution about 200 years ago, humans have continued to increase the rate at which we burn fossil fuels such as coal, oil, and natural gas, releasing carbon dioxide (CO₂) into the atmosphere. About half of the CO₂ added to the atmosphere since the beginning of the Industrial Revolution has been added since around 1980. We are warming our planet more rapidly than at any other time in human history.
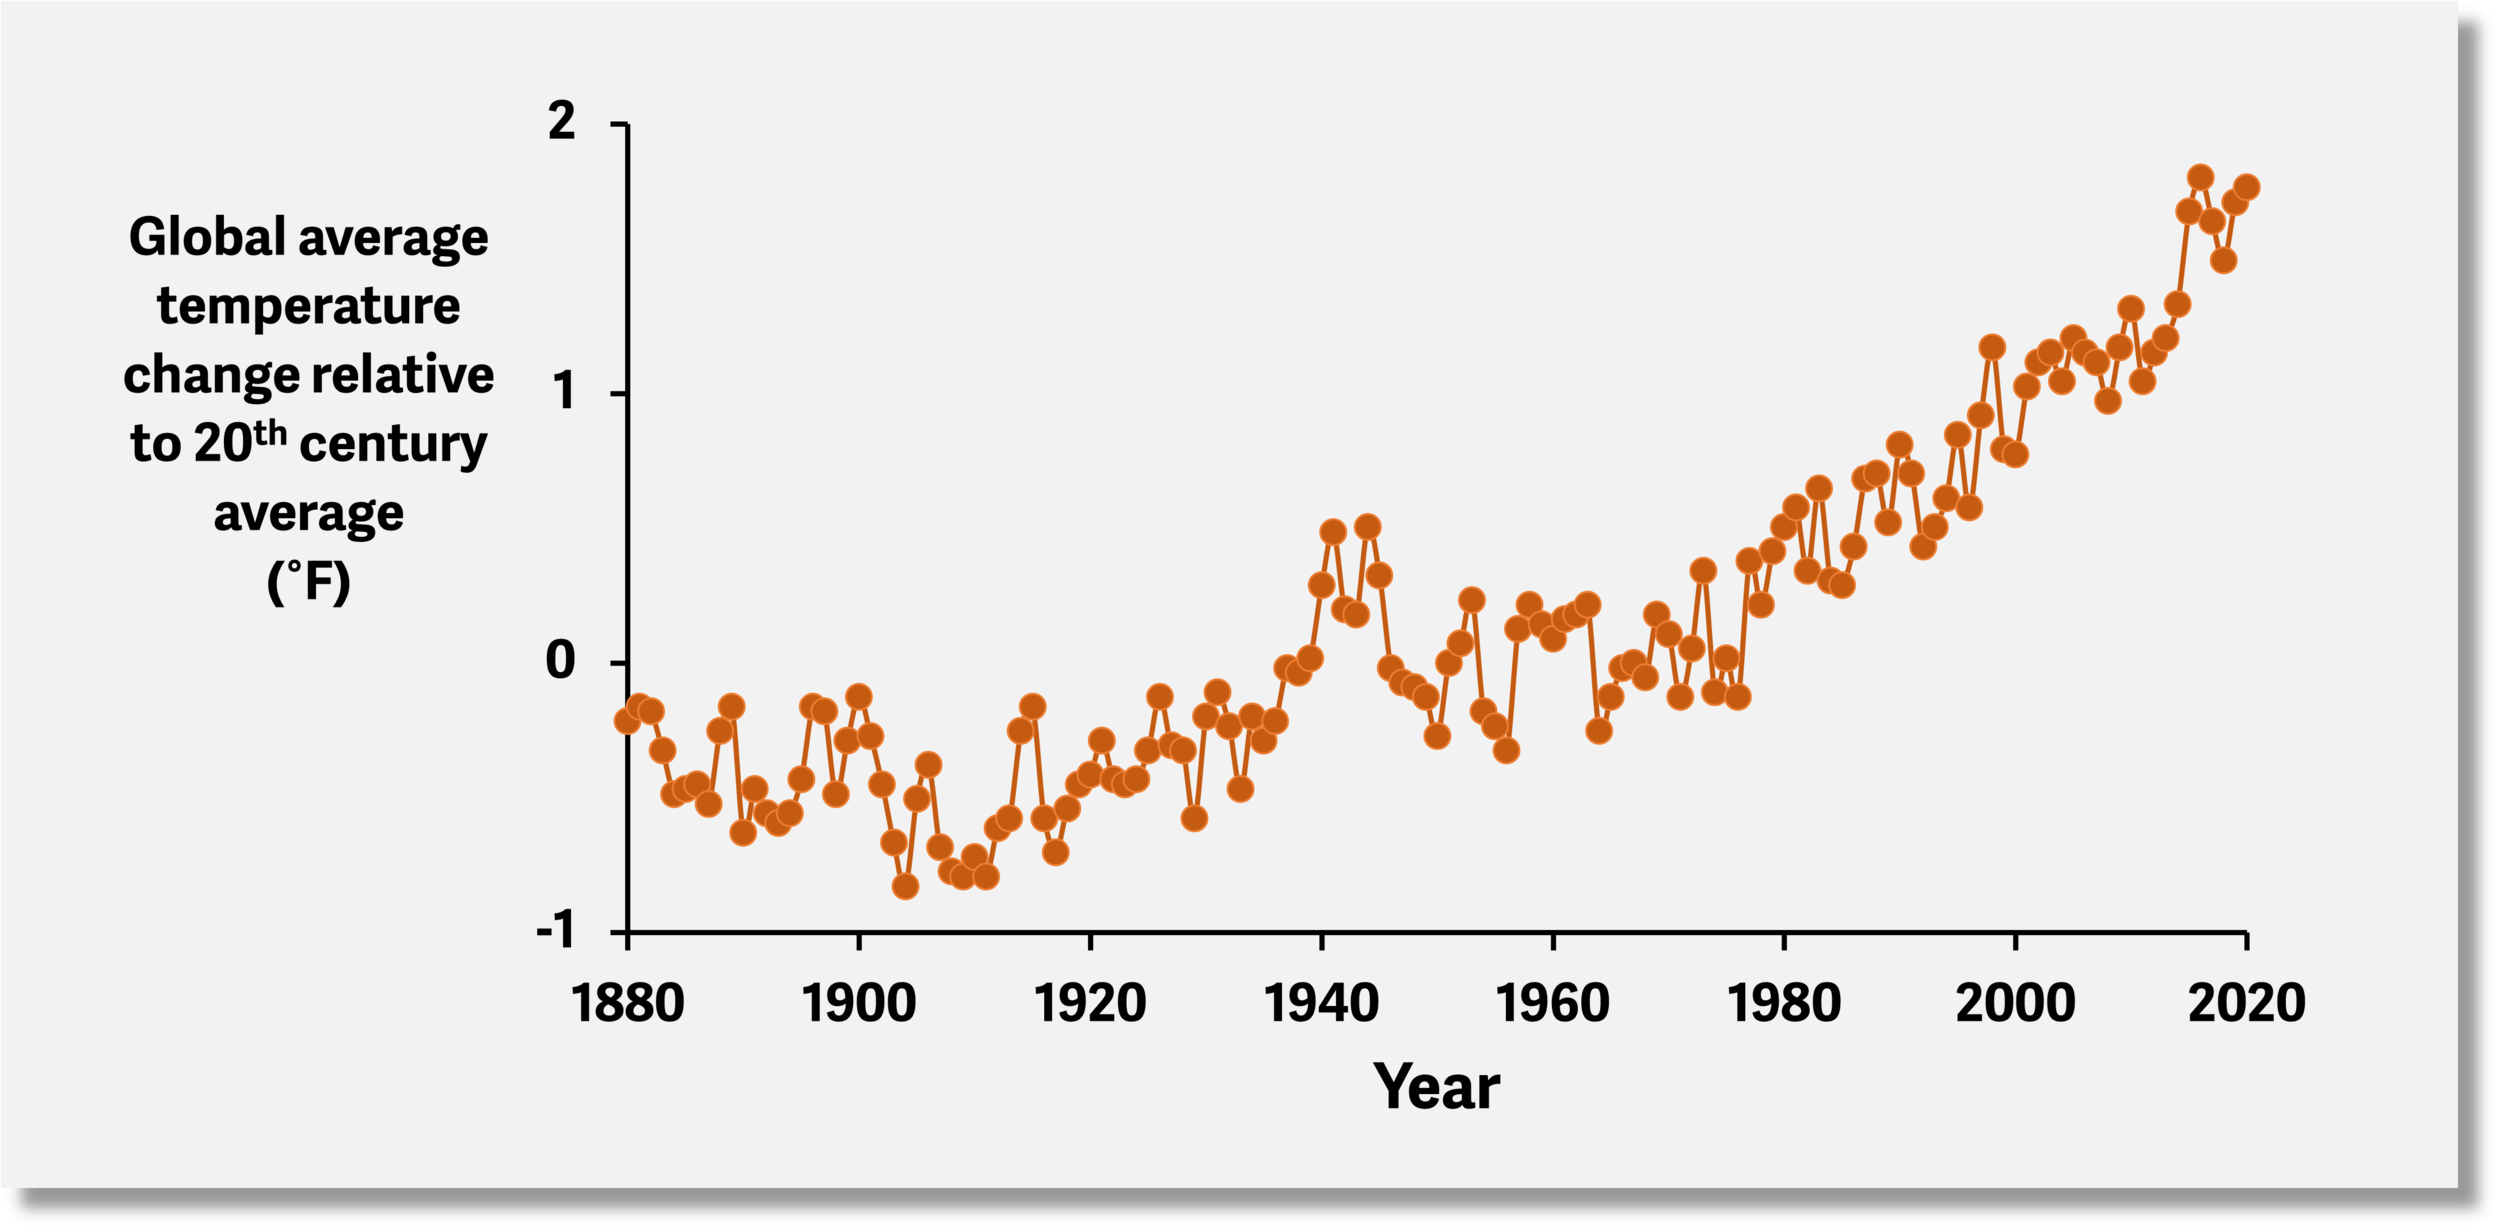
DATA: NOAA National Centers for Environmental Information, Climate at a Glance, global land and ocean temperatures, 1880-2020
What will New York State’s temperature be in the future?
To answer this question, scientists use computers to model the climate system. These models solve the equations of physics that govern the Earth’s climate, and they have inputs such as the amount of incoming solar energy and the presence of forests, water, ice, and clouds. They also include the results of human actions, such as greenhouse gas emissions from burning fossil fuels and clearing forests for farmland.
Of course, the level of greenhouse gases in the atmosphere in the future depends on the choices we make today. If we choose to reduce greenhouse gas emissions, future warming will be less severe than if we keep on emitting lots of greenhouse gases. Climate models use different emissions scenarios to reflect these choices. The graph below shows projections of future annual average temperatures, averaged over 32 different models, for New York State. The emissions scenarios are:
MEDIUM EMISSIONS: greenhouse gas emissions increase until the year 2040, after which they decrease.
HIGH EMISSIONS: greenhouse gas emissions continue to increase throughout the 21st century.
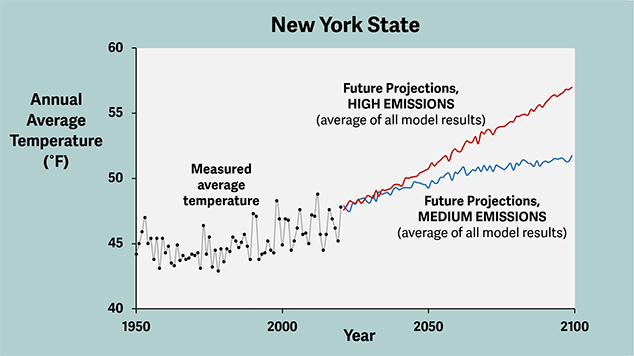
DATA: Measurements - NOAA National Centers for Environmental Information, Climate at a Glance ; Future projections - New York Climate Change Science Clearinghouse